lazyslide.pl.tissue#
- tissue(wsi, tissue_id=None, tissue_key='tissues', title=None, show_contours=True, show_id=True, mark_origin=True, scalebar=True, in_bounds=True, zoom=None, img_bytes_limit=2000000000.0, display_aware=True, oversample=1.5, target_dpi=None, ax=None, ncols=4, wspace=0.5, hspace=0.5, return_figure=False)#
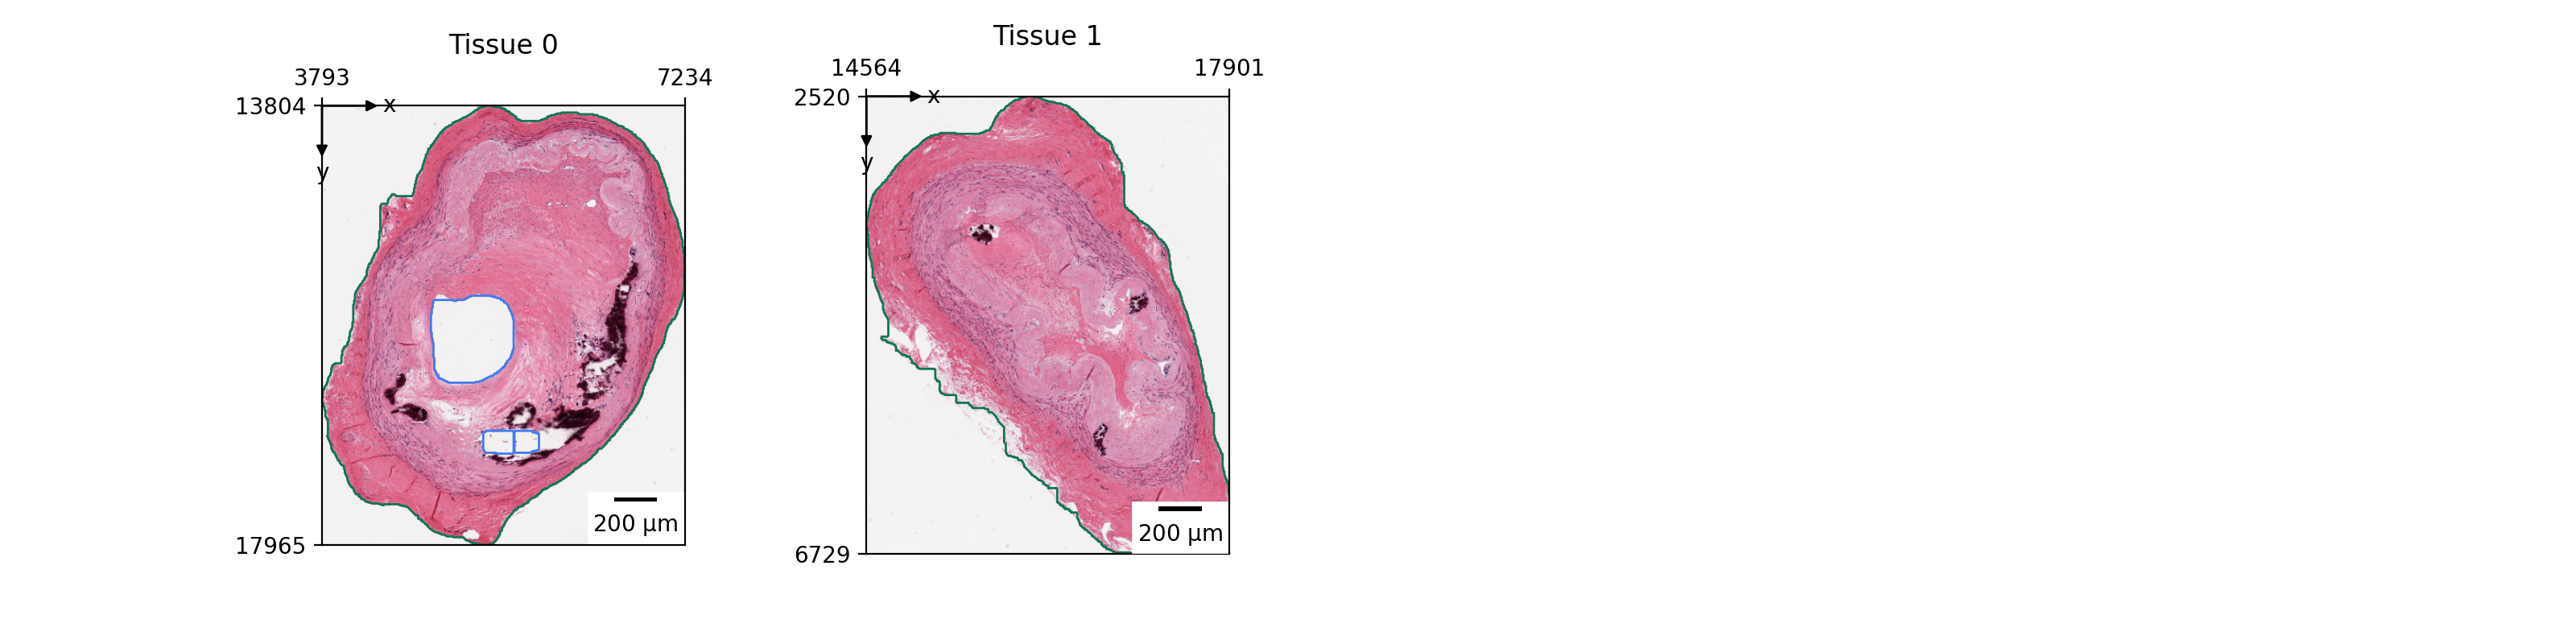
Display the tissue image.
- Parameters:
- wsi
WSIData The whole-slide image object.
- tissue_idint or ‘all’, default: None
The tissue id (piece) to extract.
- tissue_keystr, default: “tissue”
The tissue key.
- titlestr or array of str, default: None
The title of the plot.
- show_contoursbool, default: True
Show the tissue contours.
- mark_originbool, default: True
Show the origin.
- show_idbool, default: True
Show the tissue id.
- scalebarbool, default: True
Show the scalebar.
- in_boundsbool, default: True
Show the tissue in bounds.
- zoom(xmin, xmax, ymin, ymax), default: None
A zoom view for the current viewport. If in range [0, 1], will be interpreted as a fraction of the image size. If > 1, will be interpreted as the absolute size in pixels.
- img_bytes_limitint, default: 2e9
A safety ceiling on the bytes of the image to read. The level is primarily chosen from the displayed size (see
display_aware).- display_awarebool, default: True
Choose the image pyramid level from the displayed figure size at render time, avoiding reading a high-resolution image into a small figure.
- oversamplefloat, default: 1.5
Read this many times more pixels than the axes occupies, for crispness.
- target_dpifloat, optional
Override the figure DPI when sizing the image. Set to the export DPI (e.g.
target_dpi=300forsavefig(dpi=300)) for high-DPI output.- axmatplotlib.axes.Axes, default: None
The axes to plot on.
- wsi
Examples
>>> import lazyslide as zs
>>> wsi = zs.datasets.gtex_artery()
>>> zs.pl.tissue(wsi, tissue_id="all")