Cell segmentation tutorial#
This tutorial demonstrates how to perform automated cell segmentation on whole slide images (WSI) using LazySlide. We’ll walk through the complete workflow from loading a sample lung carcinoma dataset to segmenting individual cells and classifying them into different cell types.
import lazyslide as zs
wsi = zs.datasets.lung_carcinoma(with_data=False)
wsi

Reader: openslide
Dimensions: 15616×16384 (h×w), 8 Pyramids
Pixel physical size: 0.23 MPP (40X)
SpatialData object
└── Images
      └── 'wsi_thumbnail': DataArray[cyx] (3, 1817, 1906)
with coordinate systems:
    ▸ 'global', with elements:
        wsi_thumbnail (Images)
We’ll use InstanSeg for cell segmentation, which works optimally with:
MPP (Microns Per Pixel): 0.5 - This resolution provides the right balance between detail and computational efficiency
Tile size: 512x512 pixels - Optimal input size for the deep learning model
Overlap: 20% - Ensures seamless segmentation across tile boundaries
Background fraction: 95% - Filters out tiles that are mostly background/empty space
Many WSIs are too large to fit into the CPU/GPU memory to run inference, as usual, we need to tile it.
To improve the cell segmentation quality, it’s highly recommanded to create overalpping tiles
zs.pp.find_tissues(wsi)
zs.pp.tile_tissues(wsi, 512, overlap=0.2, background_fraction=0.95, mpp=0.5)
zs.pl.tiles(wsi, linewidth=0.4)
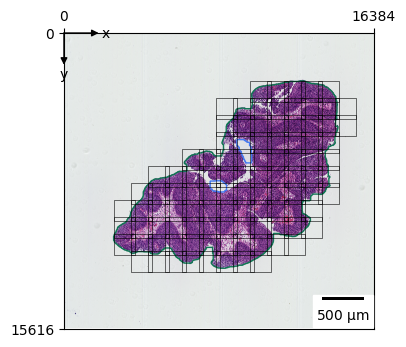
The visualization above shows the tiles that will be processed for cell segmentation. Each rectangle represents a 512x512 pixel tile at 0.5 MPP resolution. Notice how the tiles focus on tissue-rich areas while avoiding empty background regions.
Cell Segmentation#
Now we’ll perform the actual cell segmentation using InstanSeg. This deep learning model will:
Detect individual cells in each tissue tile
Generate precise cell boundaries as polygon shapes
Handle overlapping cells and complex tissue structures
The batch_size=32 parameter controls how many tiles are processed simultaneously - adjust this based on your available GPU memory.
zs.seg.cells(wsi, batch_size=32)
/home/runner/work/lazyslide-tutorials/lazyslide-tutorials/.venv/lib/python3.12/site-packages/torch/nn/modules/modul
e.py:1762: UserWarning: Sparse CSR tensor support is in beta state. If you miss a functionality in the sparse
tensor support, please submit a feature request to https://github.com/pytorch/pytorch/issues. (Triggered internally
at /pytorch/aten/src/ATen/SparseCsrTensorImpl.cpp:53.)
  return forward_call(*args, **kwargs)
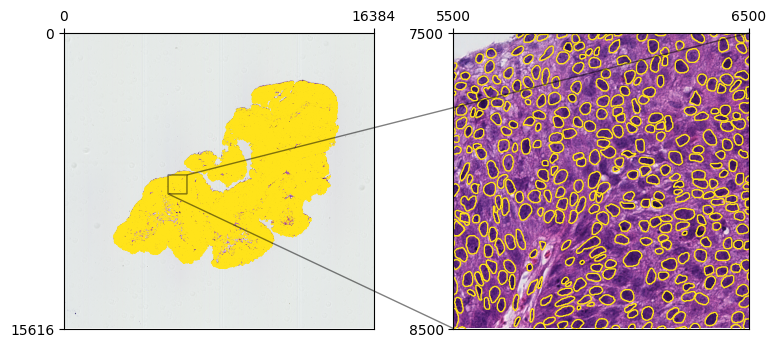
v = zs.pl.WSIViewer(wsi)
v.add_image()
v.add_polygons("cells", linewidth=1, fill=False)
v.add_zoom(5500, 6500, 7500, 8500)
v.show()
<Axes: >
Visualizing Segmented Cells#
Let’s create an interactive viewer to examine our segmentation results. The viewer will display:
Base tissue image as the background layer
Cell boundaries as polygon overlays (without fill for better visibility)
Zoomed region to inspect segmentation quality in detail
zs.seg.cell_types(wsi, batch_size=32)
Cell Type Classification#
After segmenting individual cells, we can classify them into different cell types. This step uses a specialized model that analyzes:
Cell morphology (shape, size, internal structure)
Tissue context (surrounding cell types and patterns)
Staining characteristics (intensity and distribution of H&E staining)
Common cell types in lung carcinoma include epithelial cells, stromal cells, immune cells, and various cancer cell subtypes.
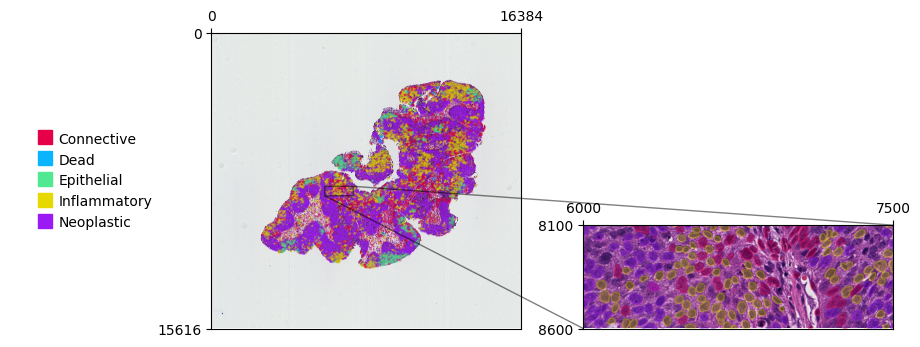
v = zs.pl.WSIViewer(wsi)
v.add_image()
v.add_polygons("cell_types", color_by="class")
<lazyslide.plotting._wsi_viewer.WSIViewer at 0x7f283c0cf9b0>
Visualizing Cell Types#
Now let’s create a color-coded visualization where each cell type is displayed in a different color. This makes it easy to:
Identify spatial patterns of different cell types
Analyze tissue organization and cellular neighborhoods
Spot regions of interest for further analysis
v.add_zoom(6000, 7500, 8100, 8600, cache=False)
v.show()
<Axes: >
Summary and Next Steps#
🎉 Congratulations! You’ve successfully completed cell segmentation and classification on a whole slide image.
What we accomplished:#
✅ Loaded and visualized a lung carcinoma WSI dataset
✅ Identified tissue regions and created optimal analysis tiles
✅ Segmented individual cells using InstanSeg deep learning model
✅ Classified cells into different morphological types
✅ Created interactive visualizations to explore results
Possible next steps:#
Quantitative analysis: Extract cell counts, sizes, and spatial metrics
Biomarker analysis: Combine with feature extraction for deeper insights
Comparative studies: Apply to multiple samples for population analysis
Custom models: Train specialized models for your specific tissue types
The segmented cells and their classifications are now stored in your WSI object and ready for downstream analysis!