
Cell segmentation tutorial#
This tutorial demonstrates how to perform automated cell segmentation on whole slide images (WSI) using LazySlide. We’ll walk through the complete workflow from loading a sample lung carcinoma dataset to segmenting individual cells and classifying them into different cell types.
import lazyslide as zs
wsi = zs.datasets.lung_carcinoma(with_data=False)
wsi

Reader: openslide
Dimensions: 15616×16384 (h×w), 8 Pyramids
Pixel physical size: 0.23 MPP (40X)
SpatialData object
with coordinate systems:
We’ll use InstanSeg for cell segmentation, which works optimally with:
MPP (Microns Per Pixel): 0.5 - This resolution provides the right balance between detail and computational efficiency
Tile size: 512x512 pixels - Optimal input size for the deep learning model
Overlap: 20% - Ensures seamless segmentation across tile boundaries
Background fraction: 95% - Filters out tiles that are mostly background/empty space
Many WSIs are too large to fit into the CPU/GPU memory to run inference. As usual, we need to tile the WSI in order to work with it.
To improve the cell segmentation quality, it’s highly recommended to create overlapping tiles.
zs.pp.find_tissues(wsi)
zs.pp.tile_tissues(wsi, 560, overlap=0.2, background_fraction=0.95, mpp=0.5)
zs.pl.tiles(wsi, linewidth=0.4)
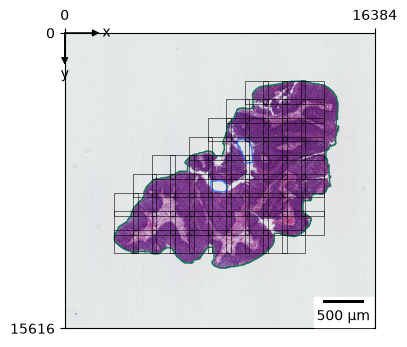
The visualization above shows the tiles that will be processed for cell segmentation. Each rectangle represents a 512x512 pixel tile at 0.5 MPP resolution. Notice how the tiles focus on tissue-rich areas while avoiding empty background regions.
Cell Segmentation#
Now we’ll perform the actual cell segmentation using InstanSeg. This deep learning model will:
Detect individual cells in each tissue tile
Generate precise cell boundaries as polygon shapes
Handle overlapping cells and complex tissue structures
The batch_size=32 parameter controls how many tiles are processed simultaneously - adjust this based on your available GPU memory.
zs.seg.cells(wsi, batch_size=32)
/home/runner/work/lazyslide-tutorials/lazyslide-tutorials/.venv/lib/python3.12/site-packages/torch/nn/modules/modul
e.py:1789: UserWarning: Sparse CSR tensor support is in beta state. If you miss a functionality in the sparse
tensor support, please submit a feature request to https://github.com/pytorch/pytorch/issues. (Triggered internally
at /pytorch/aten/src/ATen/SparseCsrTensorImpl.cpp:49.)
  return forward_call(*args, **kwargs)
Visualizing Segmented Cells#
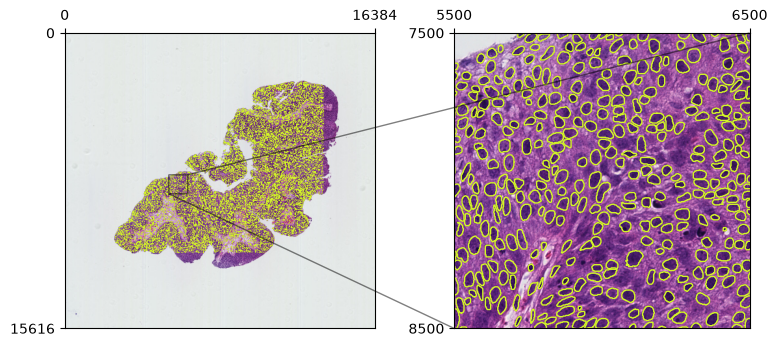
Let’s create an interactive viewer to examine our segmentation results. The viewer will display:
Base tissue image as the background layer
Cell boundaries as polygon overlays (without fill for better visibility)
Zoomed region to inspect segmentation quality in detail
v = zs.pl.WSIViewer(wsi)
v.add_image()
v.add_polygons("cells", linewidth=1, fill=False)
v.add_zoom(5500, 6500, 7500, 8500)
v.show()
<Axes: >
Cell Segmentation with Cell Type Classification#
Apart from only segmenting individual cells, we can also classify them into different cell types in the meanwhile. This step uses a specialized model that analyzes:
Cell morphology (shape, size, internal structure)
Tissue context (surrounding cell types and patterns)
Staining characteristics (intensity and distribution of H&E staining)
Common cell types in lung carcinoma include epithelial cells, stromal cells, immune cells, and various cancer cell subtypes.
The zs.seg.cell_types allows for cell classification using HistoPLUS (Introduced in LazySlide v0.9.2).
Feature vector can be computed for each cell when using ViT-based model.
zs.seg.cell_types(wsi, model="histoplus", batch_size=32, extract_features=True)
wsi["cell_types_features"]
AnnData object with n_obs × n_vars = 23271 × 768
    obs: 'cell_id', 'tile_id', 'library_id'
    uns: 'spatialdata_attrs'
v = zs.pl.WSIViewer(wsi)
v.add_image()
v.add_polygons("cell_types", color_by="class")
<lazyslide.plotting._wsi_viewer.WSIViewer at 0x7ff65335fdd0>
Visualizing Cell Types#
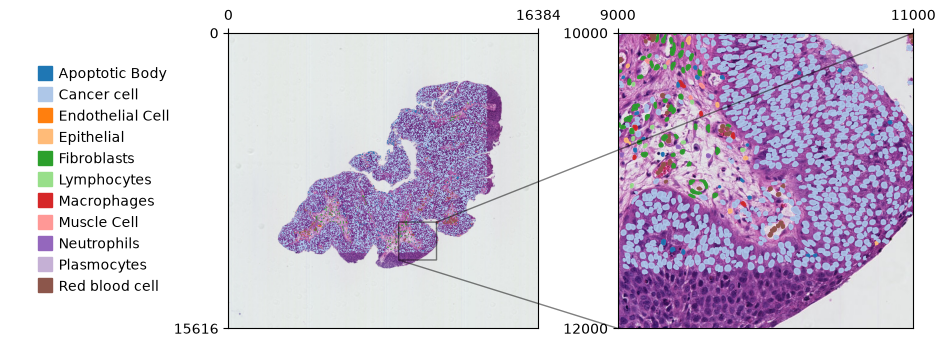
Now let’s create a color-coded visualization where each cell type is displayed in a different color. This makes it easy to:
Identify spatial patterns of different cell types
Analyze tissue organization and cellular neighborhoods
Spot regions of interest for further analysis
v.add_zoom(9000, 11000, 10000, 12000, cache=False)
v.show()
<Axes: >
Summary and Next Steps#
🎉 Congratulations! You’ve successfully completed cell segmentation and classification on a whole slide image.
What we accomplished:#
✅ Loaded and visualized a lung carcinoma WSI dataset
✅ Identified tissue regions and created optimal analysis tiles
✅ Segmented individual cells using InstanSeg deep learning model
✅ Classified cells into different morphological types
✅ Created interactive visualizations to explore results
Possible next steps:#
Quantitative analysis: Extract cell counts, sizes, and spatial metrics
Biomarker analysis: Combine with feature extraction for deeper insights
Comparative studies: Apply to multiple samples for population analysis
Custom models: Train specialized models for your specific tissue types
The segmented cells and their classifications are now stored in your WSI object and ready for downstream analysis!