
Spatial gene expression prediction from histology#
This tutorial predicts spatial gene expression directly from an H&E-stained whole-slide image with Path2Space. We use the breast Visium sample NCBI776 from HEST-1k, the same slide used by the Path2Space companion demo. HEST is a gated Hugging Face dataset, please request access to run this notebook. The two sample files occupy about 1.15 GB.
The workflow is:
Spot-centred tiling
CTransPath feature extraction
Path2Space prediction
Spatial smoothing
Comparison with measured expression.
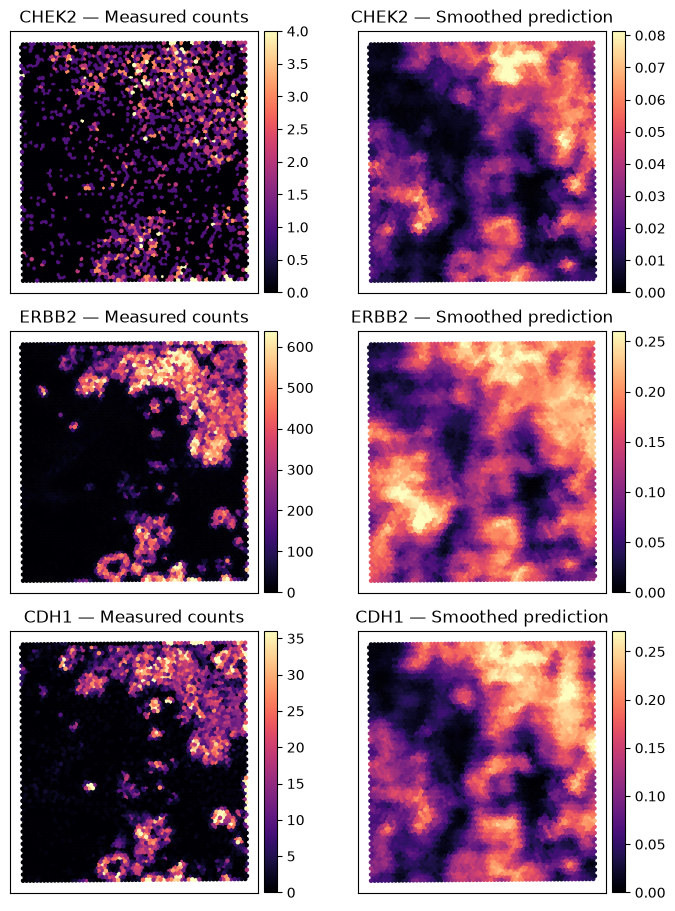
We finish by examining CHEK2, ERBB2 (HER2), and CDH1.
Path2Space estimates expression from morphology; it does not replace a molecular assay. This single-slide example is educational and must not be used for clinical decisions.
import anndata as ad
import matplotlib.pyplot as plt
import numpy as np
import pandas as pd
import torch
import torchstain
from huggingface_hub import hf_hub_download
from scipy import sparse
from scipy.spatial import cKDTree
from torchvision.transforms.v2 import Compose, Normalize, Resize, ToDtype, ToImage
from wsidata import TileSpec, open_wsi
from wsidata.io import add_tiles

import lazyslide as zs

SAMPLE_ID = "NCBI776"
HEST_REPO = "MahmoodLab/hest"
TARGET_GENES = ["CHEK2", "ERBB2", "CDH1"]
SPOT_TILE_PX = 183
Download example HEST data#
wsi_path = hf_hub_download(HEST_REPO, f"wsis/{SAMPLE_ID}.tif", repo_type="dataset")
st_path = hf_hub_download(HEST_REPO, f"st/{SAMPLE_ID}.h5ad", repo_type="dataset")
st = ad.read_h5ad(st_path)
wsi = open_wsi(wsi_path)
spot_xy = np.asarray(st.obsm["spatial"], dtype=int)[:, :2]
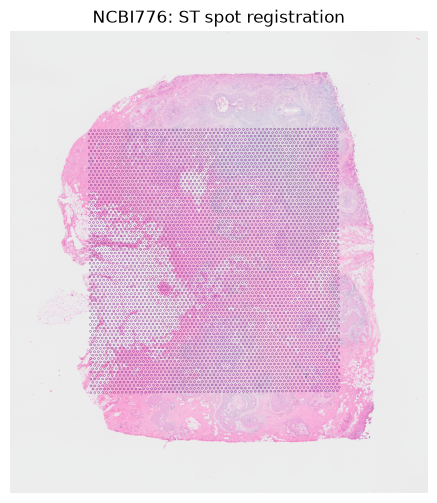
Build and visualize ST spots#
NCBI776 uses a 183-pixel field of view. To match the original usage, each integer spot centre is shifted by 183 // 2 = 91 pixels to obtain the top-left corner; the crop therefore spans [centre − 91, centre + 92). CTransPath later resizes the crop to 224×224.
For a simpler workflow, this tutorial keeps all HEST spots and does not filter by Sobel image-content.
tile_spec = TileSpec.from_wsidata(wsi, tile_px=SPOT_TILE_PX)
integer_centres = np.rint(spot_xy).astype(int)
top_left_xy = integer_centres - SPOT_TILE_PX // 2

add_tiles(
    wsi,
    key="spots",
    xys=top_left_xy,
    tile_spec=tile_spec,
    tissue_ids=np.zeros(st.n_obs, dtype=int),
)
wsi.shapes["spots"]["spot_id"] = st.obs_names.to_numpy(dtype=str)
spot_ids = wsi.shapes["spots"]["spot_id"].astype(str).to_numpy()
thumbnail = wsi.get_thumbnail(size=1000, as_array=True)
slide_height, slide_width = wsi.properties.shape
thumb_height, thumb_width = thumbnail.shape[:2]

fig, ax = plt.subplots(figsize=(6, 6))
ax.imshow(thumbnail)
ax.scatter(
    spot_xy[:, 0] * thumb_width / slide_width,
    spot_xy[:, 1] * thumb_height / slide_height,
    s=2,
    facecolors="none",
    edgecolors="#873D95",
    linewidths=0.3,
    marker="h",
)
ax.set(title=f"{SAMPLE_ID}: ST spot registration")
ax.axis("off")
plt.show()
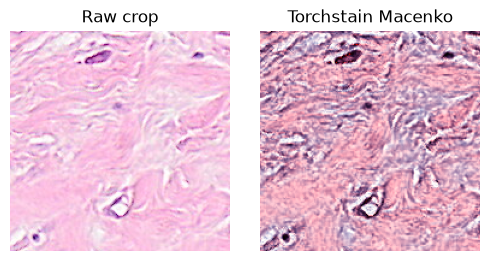
Normalize stains and feature extraction with CTransPath#
macenko_normalizer = torchstain.normalizers.MacenkoNormalizer(backend="torch")
ctranspath_transform = Compose(
    [
        ToImage(),
        ToDtype(dtype=torch.float32, scale=True),
        Resize(size=(224, 224), antialias=False),
        Normalize(mean=(0.485, 0.456, 0.406), std=(0.229, 0.224, 0.225)),
    ]
)


def path2space_macenko(tile, return_rgb=False):
    tile = np.asarray(tile, dtype=np.uint8)
    brightness = np.percentile(tile, 95)
    brightness = max(brightness, 1.0)
    standardized = np.clip(tile.astype(np.float32) * 255.0 / brightness, 0, 255).astype(
        np.uint8
    )
    tensor = torch.from_numpy(standardized.copy()).permute(2, 0, 1)
    try:
        normalized, _, _ = macenko_normalizer.normalize(
            I=tensor, Io=255, alpha=1, beta=0.15, stains=False
        )
        normalized = normalized.clamp(0, 255).to(torch.uint8).cpu().numpy()
    except (IndexError, RuntimeError):
        normalized = standardized
    if return_rgb:
        return normalized
    return ctranspath_transform(normalized)


tile_dataset = wsi.ds.tile_images(tile_key="spots")
preview_index = len(tile_dataset) // 2
preview_raw = np.asarray(tile_dataset[preview_index]["image"])
preview_normalized = path2space_macenko(preview_raw, return_rgb=True)
fig, axes = plt.subplots(1, 2, figsize=(5, 2.5), constrained_layout=True)
for ax, image, title in zip(
    axes,
    [preview_raw, preview_normalized],
    ["Raw crop", "Torchstain Macenko"],
    strict=True,
):
    ax.imshow(image)
    ax.set_title(title)
    ax.axis("off")
plt.show()
zs.tl.feature_extraction(
    wsi,
    "ctranspath",
    tile_key="spots",
    batch_size=64,
    amp=False,
    transform=path2space_macenko,
)
Predict expression with Path2Space#
feature_prediction resolves the Path2Space ensemble and consumes the CTransPath feature table. A small batch limits the ensemble’s intermediate memory. Predictions are aligned to HEST barcodes through the tile table rather than by relying on positional reassignment.
zs.tl.feature_prediction(
    wsi,
    "path2space",
    tile_key="spots",
    batch_size=16,
    amp=False,
)
pred_raw = wsi.tables["path2space_spots"].copy()
pred_raw.obs_names = pd.Index(spot_ids, name="spot_id")
prediction_values = np.asarray(pred_raw.X, dtype=np.float32)
Apply spatial smoothing#
The tiles are converted to integer grid coordinates, a radius-2 KDTree neighborhood is built, and each prediction is replaced by the uniform mean of its neighborhood (including itself).
selected_xy = np.asarray(st[spot_ids].obsm["spatial"], dtype=float)[:, :2]
grid_coordinates = np.column_stack(
    [
        ((selected_xy[:, 0] - selected_xy[:, 0].min()) / SPOT_TILE_PX + 1).astype(int),
        ((selected_xy[:, 1] - selected_xy[:, 1].min()) / SPOT_TILE_PX + 1).astype(int),
    ]
)
neighbors = cKDTree(grid_coordinates).query_ball_point(grid_coordinates, r=2.0)
row_indices = np.repeat(np.arange(len(neighbors)), [len(group) for group in neighbors])
column_indices = np.concatenate(neighbors)
weights = np.concatenate(
    [np.full(len(group), 1 / len(group), dtype=np.float32) for group in neighbors]
)
smoothing_matrix = sparse.csr_matrix(
    (weights, (row_indices, column_indices)),
    shape=(len(neighbors), len(neighbors)),
)

pred_smoothed = pred_raw.copy()
pred_smoothed.X = smoothing_matrix @ prediction_values
Compare with measured expression#
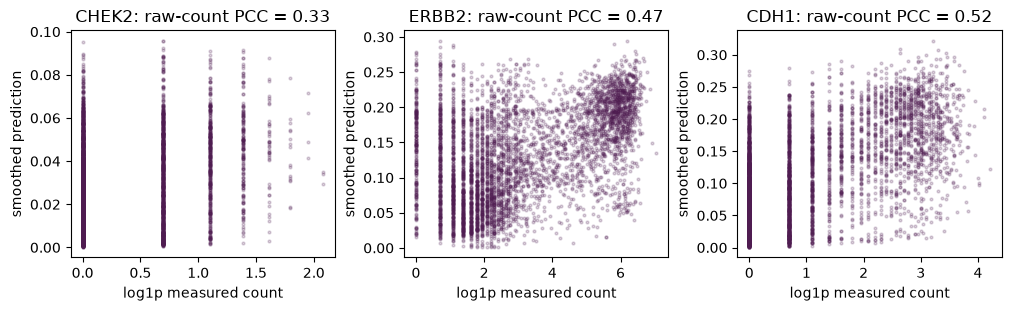
Path2Space outputs are not calibrated to the absolute units of measured counts, so we compare spatial patterns using per-gene Pearson correlation. Constant genes are reported as missing correlations.
common_genes = st.var_names.intersection(pred_raw.var_names, sort=False)
measured = st[spot_ids, common_genes].copy()
pred_raw = pred_raw[spot_ids, common_genes].copy()
pred_smoothed = pred_smoothed[spot_ids, common_genes].copy()
def dense_array(matrix):
    return matrix.toarray() if sparse.issparse(matrix) else np.asarray(matrix)


def per_gene_pearson(measured, predicted, chunk_size=512):
    correlations = []
    for start in range(0, measured.n_vars, chunk_size):
        stop = min(start + chunk_size, measured.n_vars)
        observed = dense_array(measured.X[:, start:stop]).astype(np.float32)
        estimated = dense_array(predicted.X[:, start:stop]).astype(np.float32)
        observed -= observed.mean(axis=0)
        estimated -= estimated.mean(axis=0)
        denominator = np.sqrt((observed**2).sum(axis=0) * (estimated**2).sum(axis=0))
        correlations.append(
            np.divide(
                (observed * estimated).sum(axis=0),
                denominator,
                out=np.full(stop - start, np.nan, dtype=np.float32),
                where=denominator > 0,
            )
        )
    return pd.Series(np.concatenate(correlations), index=measured.var_names)


gene_correlations = pd.DataFrame(
    {
        "raw prediction": per_gene_pearson(measured, pred_raw),
        "smoothed prediction": per_gene_pearson(measured, pred_smoothed),
    }
)
gene_correlations.median().rename("median Pearson correlation")
raw prediction         0.275498
smoothed prediction    0.345017
Name: median Pearson correlation, dtype: float32
gene_correlations.loc[TARGET_GENES]
| raw prediction | smoothed prediction | |
|---|---|---|
| CHEK2 | 0.291663 | 0.332098 |
| ERBB2 | 0.400178 | 0.471052 |
| CDH1 | 0.419189 | 0.523107 |
Spatial maps of breast-cancer genes#
Measured counts and predictions use different units, so each map has its own color scale.
fig, axes = plt.subplots(len(TARGET_GENES), 2, figsize=(7, 9), constrained_layout=True)
for row, gene in enumerate(TARGET_GENES):
    observed = dense_array(measured[:, gene].X).ravel()
    estimated = dense_array(pred_smoothed[:, gene].X).ravel()
    panels = [(observed, "Measured counts"), (estimated, "Smoothed prediction")]
    for ax, (values, title) in zip(axes[row], panels, strict=True):
        artist = ax.scatter(
            selected_xy[:, 0],
            selected_xy[:, 1],
            c=values,
            s=5,
            cmap="magma",
            vmin=0,
            vmax=np.quantile(values, 0.99),
        )
        ax.invert_yaxis()
        ax.set_aspect("equal")
        ax.set_xticks([])
        ax.set_yticks([])
        ax.set_title(f"{gene} — {title}")
        fig.colorbar(artist, ax=ax, fraction=0.046, pad=0.02)
plt.show()
fig, axes = plt.subplots(1, len(TARGET_GENES), figsize=(10, 3), constrained_layout=True)
for ax, gene in zip(axes, TARGET_GENES, strict=True):
    observed = dense_array(measured[:, gene].X).ravel()
    estimated = dense_array(pred_smoothed[:, gene].X).ravel()
    ax.scatter(np.log1p(observed), estimated, s=4, alpha=0.2, color="#4F1C51")
    ax.set(
        title=f"{gene}: raw-count PCC = {gene_correlations.loc[gene, 'smoothed prediction']:.2f}",
        xlabel="log1p measured count",
        ylabel="smoothed prediction",
    )
plt.show()
Predict expression with DeepSpot-M#
Path2Space works from the precomputed CTransPath features through tl.feature_prediction. DeepSpot-M takes a different route: it is a tile_prediction model that goes straight from each H&E tile to expression, using a LoRA-adapted Midnight backbone with a cross-attention gene decoder. Because it reads the tiles directly, we call it through tl.tile_prediction and skip the separate feature-extraction step; each crop is resized to 224 px inside the model.
The weights are gated and non-commercial. Request access on the model page, run huggingface-cli login, then install the package with pip install git+https://github.com/ratschlab/DeepSpotM.git.
from lazyslide_models.tile_prediction import DeepSpotM

# DeepSpot-M scores tiles directly — no CTransPath features required.
# Restrict to the marker panel we compare below; pass genes=None for the full ~19k-gene panel.
zs.tl.tile_prediction(wsi, DeepSpotM(genes=TARGET_GENES), tile_key="spots", batch_size=16)

# tile_prediction writes one column per gene onto the spot tile table, in tile order.
# Collect them into an AnnData aligned to the HEST spot barcodes used above.
deepspotm_pred = ad.AnnData(
    X=wsi.shapes["spots"][TARGET_GENES].to_numpy(dtype=np.float32),
    obs=pd.DataFrame(index=pd.Index(spot_ids, name="spot_id")),
    var=pd.DataFrame(index=pd.Index(TARGET_GENES, name="gene")),
)
Compare DeepSpot-M and Path2Space#
Both models predict the same three markers, so we can score them the same way: per-gene Pearson correlation against the measured HEST counts. Here we place DeepSpot-M next to Path2Space in both its raw and smoothed form, using the marker panel as a shared reference.
# Per-gene Pearson correlation of each prediction against the measured counts.
deepspotm_corr = per_gene_pearson(measured[:, TARGET_GENES].copy(), deepspotm_pred)
benchmark = pd.DataFrame(
    {
        "Path2Space (raw)": gene_correlations.loc[TARGET_GENES, "raw prediction"],
        "Path2Space (smoothed)": gene_correlations.loc[TARGET_GENES, "smoothed prediction"],
        "DeepSpot-M": deepspotm_corr,
    }
)
benchmark
| Path2Space (raw) | Path2Space (smoothed) | DeepSpot-M | |
|---|---|---|---|
| CHEK2 | 0.291691 | 0.332124 | 0.458160 |
| ERBB2 | 0.400301 | 0.471222 | 0.776366 |
| CDH1 | 0.419225 | 0.523148 | 0.740558 |
# Grouped bars of the per-gene Pearson correlations from the table above.
ax = benchmark.plot.bar(
    figsize=(7.5, 3.5),
    color=["#C9A9D4", "#873D95", "#4F1C51"],
    width=0.78,
    edgecolor="white",
    rot=0,
)
for container in ax.containers:
    ax.bar_label(container, fmt="%.2f", fontsize=7, padding=2)
ax.set(ylabel="Pearson correlation", xlabel="", ylim=(0, 1))
ax.set_title("Marker-gene agreement with measured expression", fontsize=11)
ax.legend(frameon=False, fontsize=8, loc="center left", bbox_to_anchor=(1.01, 0.5))
ax.spines[["top", "right"]].set_visible(False)
plt.tight_layout()
plt.show()

# Spatial maps of each marker: measured counts beside the Path2Space and DeepSpot-M predictions.
fig, axes = plt.subplots(len(TARGET_GENES), 3, figsize=(9, 9), constrained_layout=True)
panel_titles = ["Measured counts", "Path2Space (smoothed)", "DeepSpot-M"]
for row, gene in enumerate(TARGET_GENES):
    panel_values = [
        dense_array(measured[:, gene].X).ravel(),
        dense_array(pred_smoothed[:, gene].X).ravel(),
        dense_array(deepspotm_pred[:, gene].X).ravel(),
    ]
    for ax, values, title in zip(axes[row], panel_values, panel_titles, strict=True):
        artist = ax.scatter(
            selected_xy[:, 0],
            selected_xy[:, 1],
            c=values,
            s=5,
            cmap="magma",
            vmin=0,
            vmax=np.quantile(values, 0.99),
        )
        ax.invert_yaxis()
        ax.set_aspect("equal")
        ax.set_xticks([])
        ax.set_yticks([])
        ax.set_title(f"{gene} — {title}", fontsize=9)
        fig.colorbar(artist, ax=ax, fraction=0.046, pad=0.02)
plt.show()

Conclusions#
This workflow uses spot-centred crops, Macenko stain normalization, CTransPath features, and Path2Space prediction. Spatial smoothing improves agreement with measured expression for this example, while independently scaled maps avoid implying that predicted values are calibrated molecular counts.
DeepSpot-M reaches the same three markers by a different path, predicting expression end-to-end from the tiles without a separate feature-extraction step. Its per-gene correlations and spatial maps are shown above next to the Path2Space results for the same slide.
This remains a single-slide demonstration and is not intended for clinical use.